Processing Prometheus alerts using NodeRED
I’m currently building some home automation stuff using NodeRED. One of the things I need to do is trigger home automation actions from Prometheus: I’m monitoring our Solar panels using it, and I want the shutters to go down whenever it’s sunny outside. I have a Prometheus alert rule that tells me when that is. But how can I trigger NodeRED from there?
As an extra challenge, I wanted to see if I can actually do this without writing a single line of code. I do need a couple more nodes this way, but it works and it’s not all that complicated. Here’s how it’s done.
Prometheus: Alert Manager
First of all, we need to tell the Alert Manager that it shall send
alerts also to our NodeRED instance. This is achieved in
alert-manager.conf:
route:
  # ...
  routes:
    - receiver: 'nodered'
      continue: true
    - receiver: 'whatever else you have'

receivers:
- name: 'nodered'
  webhook_configs:
  - send_resolved: true
    url: http://your-nodeRED/prometheus
This instructs Alert-Manager to pipe all alerts through NodeRED as a
webhook, before sending it to the other receivers that may or may not be
listed in the config (that’s what the continue: true part
does).
Note that the /prometheus part of the URL can be chosen
freely, it just needs to match the URL that you set your HTTP input node
to.
Now reload Alert-Manager and you’re good to go!
NodeRED: HTTP Post and Response
So the first thing we should probably be doing is set up NodeRED in a way that it can react to Prometheus correctly and receive alerts, sending back an HTTP 200 response to every request that comes from Alert-Manager. Since we don’t want to be sending the payload back in every response, we set it to an empty string before responding. And since we’d like to see the alerts we receive in the Debug console to make sure we’re actually doing something, let’s also add a Debug node in. The whole flow now looks like this:
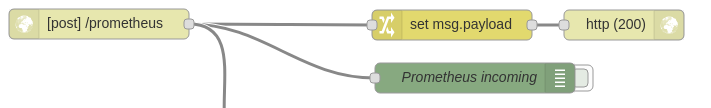
As you can see, the pipeline consists of an HTTP input node
configured to listen on the /prometheus URL. This one pipes
its data into a “change” node to set the payload to an empty string,
like so:
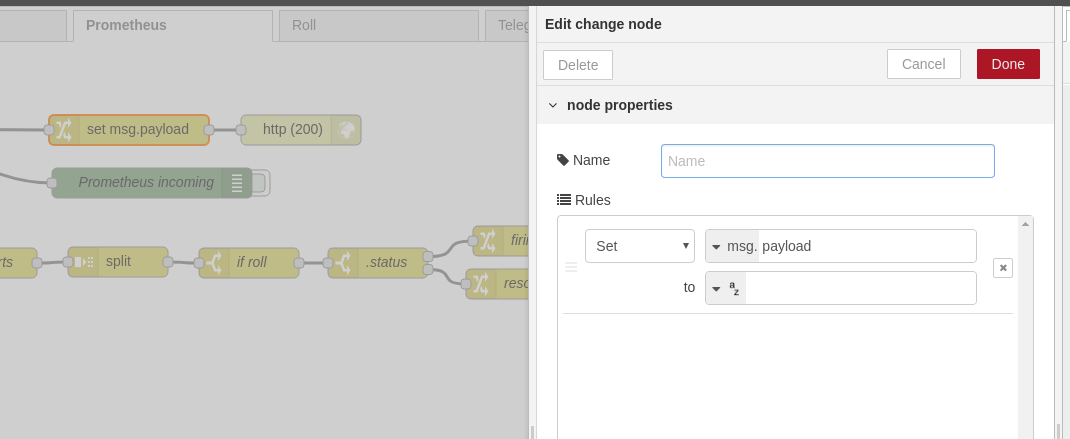
And finally, an HTTP Response node that sends an empty HTTP 200 Ok response back to Prometheus. Further, there’s a debug node included that logs all the messages we receive on that input. Deploy, and your pipe is already working!
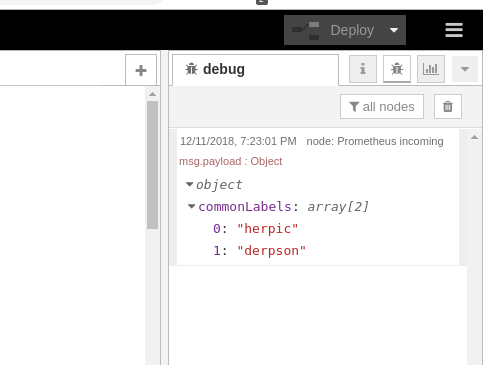
To test it, you can send data to it like this:
curl --header "Content-Type: application/json" \
     --request POST \
     --data '{"commonLabels": ["herpic","derpson"]}' \
     http://your-nodeRED/prometheus
As a result, you should see a message like this one appearing in the Debug tab of the sidebar in NodeRED:
Disecting the payload
It’s good that we’re able to receive messages from Prometheus, but now we also need to make sense of them. Since this doesn’t have to do anything with the response that we send to Prometheus, we’ll do this as a separate branch of our flow that we also attach to the Input node.
The complete pipeline looks like this:
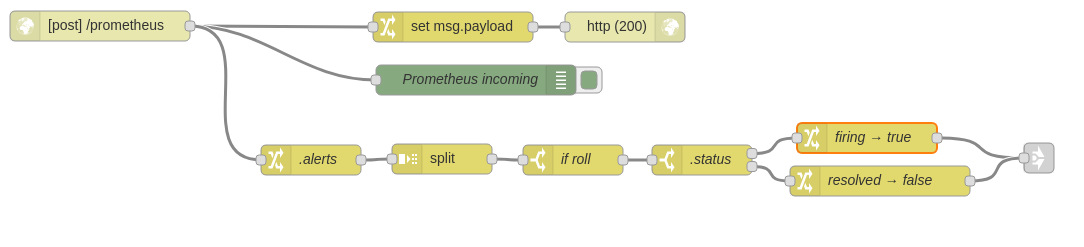
Let’s examine how it works.
The
prometheus documentation has some information on how exactly the
payload looks that Alert-Manager will send us. In short, there’s an
object that tells us whether the alerts it’s talking about are currently
active (“firing”) or have just been cleared (“resolved”), and what those
alerts are. I’m specifically looking for an alert that has a
label called trigger with value roll, because
I want that one to trigger my rollershutter. When the alert is firing we
should close the rollershutter, and when the alert is resolved, open it
back up. This involves a number of nodes:
-
We’re only interested in the
alertspart of the response, so first we transform our message to only consist of that part. This is easily achieved using achangenode, configured to set the payload from itsalertsproperty: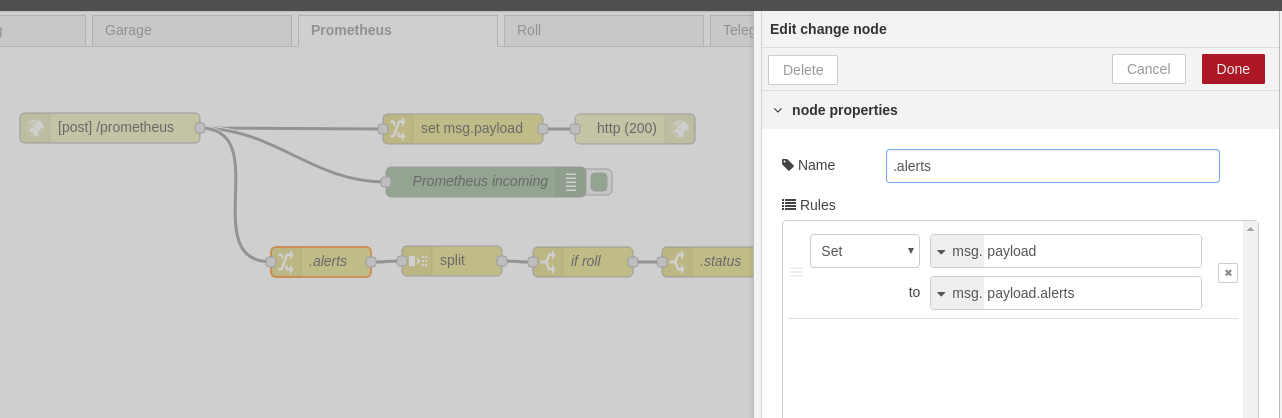
We just transformed the payload into a plain list of alerts. Next, we’ll want to look at the individual alerts one by one. So let’s pipe them through a
splitnode, which will pass on each alert as a new message to the nodes after it. The default config is totally fine, you don’t need to adjust anything about this node.-
Once we get a stream of individual alerts, we can start looking for the one we’re actually interested in. To do that, we use a
switchnode. Those nodes can evaluate certain conditions on the messages they receive, and route the message to different outputs depending on the content. Since we’re only interested in messages that have the label we’re looking for, we’ll just discard the rest. Thus, our switch node only has one single output, configured like this: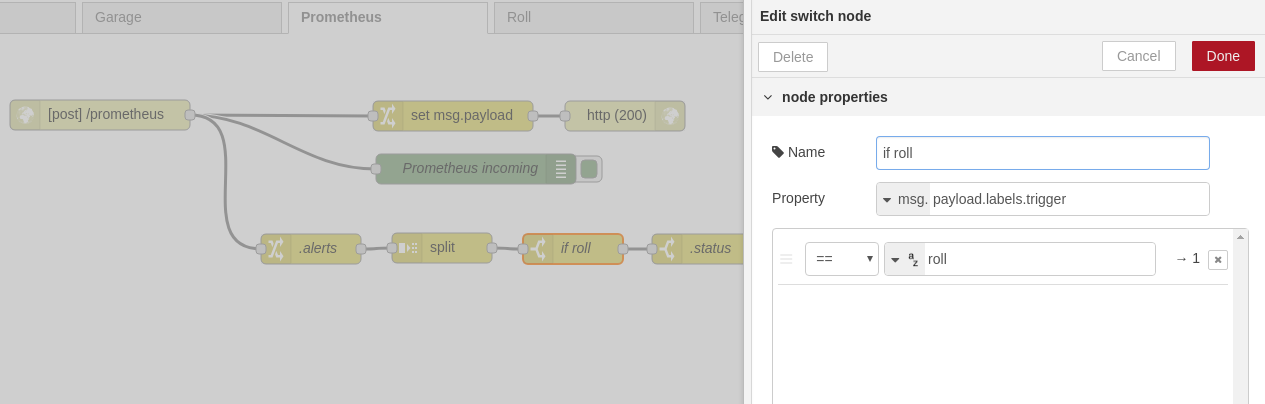
-
Once we found an alert that carries a
trigger: rolllabel, we’ll want to generate a message that indicates whether the sun is shining or gone by translating the rest of the message to a boolean value. Thestatusvalue is helpfully also included in every individual alert, so we still have that information even though we discarded the initial wrapper object in step 1. Since we now want to react both on “firing” and on “resolved”, we’ll need a switch node with two outputs: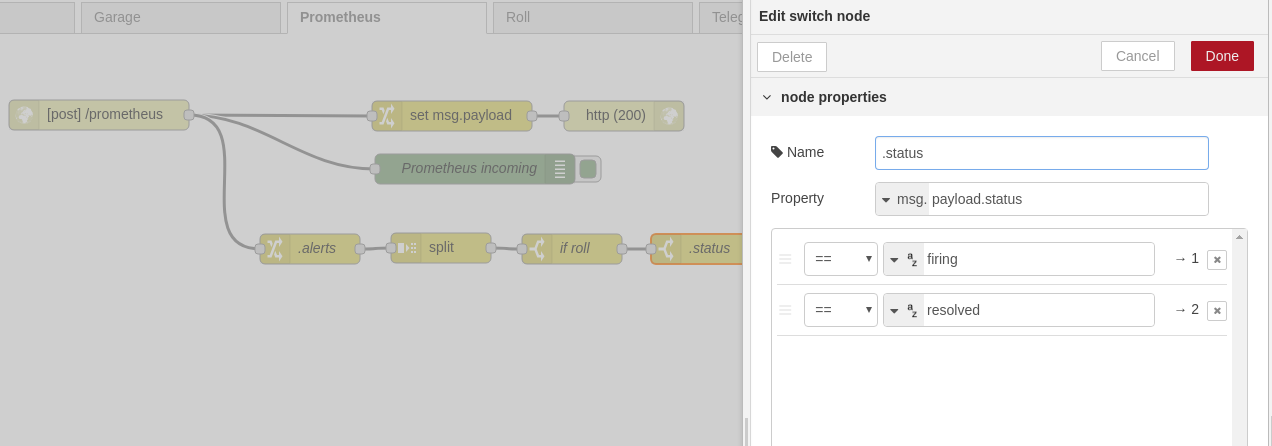
-
Now we’ll use two switch nodes to set the message payload to
truewhen the sun is shining, andfalsewhen it isn’t: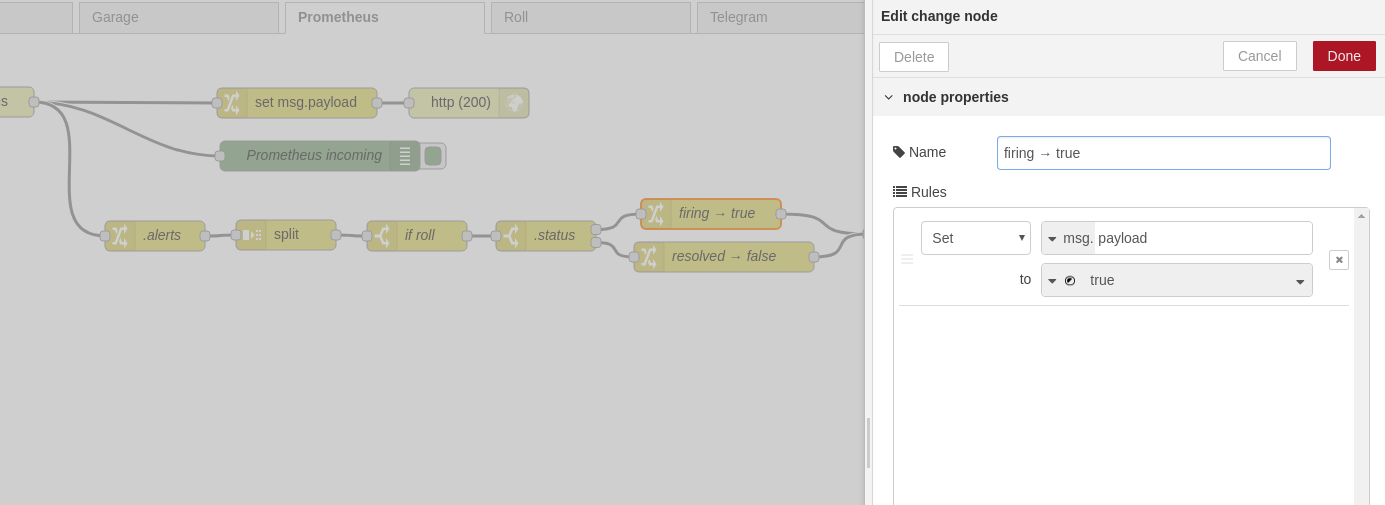
As you may have guessed, the
resolved → falsenode sets the message payload tofalsewhenever an alert with status “resolved” is received. Last but not least, we pipe messages from both nodes into a Flow Link Output node, so that we can pass the value on to another flow that controls the actual rollershutter.
And that’s how you can use NodeRED to process alerts from Prometheus!