Ceph Bluestore/Filestore latency
We’ve been looking deeply into Ceph Storage latency, comparing BlueStore and FileStore, and looking at methods how to get below the magic 2ms write latency mark in our Proxmox clusters. Here’s what we found.
The endeavour was sparked by our desire to run ZooKeeper on our Proxmox Clusters. ZooKeeper is highly sensitive to IO latency: If writes are too slow, it will log messages like this one:
fsync-ing the write ahead log in SyncThread:1 took 1376ms which will adversely effect operation latency.File size is 67108880 bytes. See the ZooKeeper troubleshooting guideSubsequently, ZooKeeper nodes will consider themselves broken and restart. If the thing that’s slow is your Ceph cluster, this means that all three VMs will be affected at the same time, and you’ll end up losing your ZooKeeper cluster altogether.
We mitigated this by moving ZooKeeper to local disks, and getting rid of the Ceph layer in between. But that is obviously not a satisfactory solution, so we’ve spent some time looking into Ceph latency.
Unfortunately, there’s not a lot of advice to be found other than “buy faster disks”. This didn’t seem to cut it for us: Our hosts were reporting 0.1ms of disk latency, while the VMs measured 2ms of latency. If our hosts had weighed in at 1.8ms, I’d be willing to believe that we have a disk latency issue - but not with the discrepancy that we were seeing. So let’s dive in and see if we can find other issues.
Hardware setup
We have two clusters of 4 nodes each, where each node has:
- CPU: 2x
Intel(R) Xeon(R) Gold 5115 CPU @ 2.40GHz, 10 Cores / 20 Threads each, - 256GB RAM,
- PERC RAID controller,
- CacheVault installed,
- Disk cache disabled.
Disk setups in the two clusters are not identical though:
nodes in one cluster are running 8 10kRPM SAS disks plus 4 journal SSDs, PERC RAID controller set to Passthrough mode,
nodes in the other cluster are using 10 10kRPM SAS disks, PERC RAID controller running two instances of RAID5 with four data disks each. The resulting
/dev/sdXdevices are managed by LVM, and LVs are striped over both RAIDs. Both layers operate at a chunk size of 256KiB.
All hosts are connected to a 1GE frontend network which is used for applications and SSH, and a separate 10GE backend network used for PVE and Ceph.
Test utilities
To conduct our tests, we’ve combined a number of measurement tools:
-
iostatas described in my blog post about Measuring storage performance, -
biolatency-bpfccfrom thebpfcc-toolspackage.
And a few load generators, run under the rationale outlined in my How to run relevant benchmarks post:
-
distmark, of which we ran one instance that each did1 IOPSin 100 VMs in parallel, -
fio, using this command line:fio -ioengine=libaio -direct=1 -sync=1 -name=test -bs=4k -iodepth=1 -rw=randwrite -runtime=60 --size=2048m --time_based.
Disks
As noted above, we moved ZooKeeper to local disks (meaning, writing
directly to the RAID instances rather than writing to them through
Ceph). biolatency nicely shows the difference that this
makes, thus providing us with a baseline performance: It is unreasonable
to expect Ceph to be faster than the hardware alone. So, here’s
the reading from the local disks:
# timeout -s SIGINT  30s /usr/sbin/biolatency-bpfcc -D
Tracing block device I/O... Hit Ctrl-C to end.


disk = 'sda'
     usecs               : count     distribution
         0 -> 1          : 0        |                                        |
         2 -> 3          : 0        |                                        |
         4 -> 7          : 0        |                                        |
         8 -> 15         : 0        |                                        |
        16 -> 31         : 0        |                                        |
        32 -> 63         : 0        |                                        |
        64 -> 127        : 0        |                                        |
       128 -> 255        : 497      |*****                                   |
       256 -> 511        : 3927     |****************************************|
       512 -> 1023       : 96       |                                        |
      1024 -> 2047       : 22       |                                        |
      2048 -> 4095       : 41       |                                        |
And here’s Ceph:
# timeout -s SIGINT  30s /usr/sbin/biolatency-bpfcc
Tracing block device I/O... Hit Ctrl-C to end.

     usecs               : count     distribution
         0 -> 1          : 0        |                                        |
         2 -> 3          : 0        |                                        |
         4 -> 7          : 0        |                                        |
         8 -> 15         : 0        |                                        |
        16 -> 31         : 0        |                                        |
        32 -> 63         : 0        |                                        |
        64 -> 127        : 0        |                                        |
       128 -> 255        : 0        |                                        |
       256 -> 511        : 0        |                                        |
       512 -> 1023       : 0        |                                        |
      1024 -> 2047       : 66       |***************************             |
      2048 -> 4095       : 96       |****************************************|
      4096 -> 8191       : 14       |*****                                   |
      8192 -> 16383      : 8        |***                                     |
Note that the underlying hardware is exactly the same: The only thing
that changed is that we plugged Ceph in between. Our goal is to get most
IO to occur in the 512 -> 1023 bucket.
From now on, when posting biolatency readings, I’ll omit
buckets that are 0 for brevity.
VM storage driver
Using the virtio driver instead does not seem to provide
a huge benefit:
# timeout -s SIGINT  30s /usr/sbin/biolatency-bpfcc -D
Tracing block device I/O... Hit Ctrl-C to end.

     usecs               : count     distribution
       512 -> 1023       : 12       |**                                      |
      1024 -> 2047       : 74       |**************                          |
      2048 -> 4095       : 206      |*************************************** |
      4096 -> 8191       : 211      |****************************************|
      8192 -> 16383      : 10       |*                                       |
     16384 -> 32767      : 7        |*                                       |
We also played with the cache settings for a bit, but
since random writes are mostly synchronous, this didn’t yield an
improvement either.
Jumbo frames
We tried enabling Jumbo frames in the backend network (the one used for Ceph). Surprisingly, this did not yield any benefit at all, so we ended up reverting the change. More on that below.
Filestore vs Bluestore
So far, our OSDs have been running on Filestore because by the time we set them up, Bluestore had only just been released and we hadn’t adapted our architecture to it just yet. Thus, we gave it a try to see if it performs better than Filestore.
We are running Filestore on XFS tuned to match the layout of our RAID devices, specifically:
mkfs -t xfs -b size=4096 -s size=512 -d su=256k -d sw=4 -l su=256k /dev/sdXDue to the way Bluestore is designed, we were expecting latency to be cut roughly in half.
For comparison, here’s our reading for Filestore on the cluster using RAID:
# timeout -s SIGINT 30 biolatency-bpfcc -D
     usecs               : count     distribution
      1024 -> 2047       : 1        |                                        |
      2048 -> 4095       : 109      |****************************************|
      4096 -> 8191       : 3        |*                                       |
      8192 -> 16383      : 25       |*********                               |
     16384 -> 32767      : 65       |***********************                 |
And here’s Bluestore, writing to exactly the same hardware:
# timeout -s SIGINT 30 biolatency-bpfcc -D
     usecs               : count     distribution
      1024 -> 2047       : 0        |                                        |
      2048 -> 4095       : 78       |****************************************|
      4096 -> 8191       : 13       |******                                  |
      8192 -> 16383      : 1        |                                        |
While tail latency seems to have improved ever so slightly, the base
line of 2ms still seems to be rock solid. Frankly, I’m
quite disappointed, and unfortunately this disappointment was only being
reinforced by further measurements.
The Gold mine
Googling has revealed this wiki page: https://yourcmc.ru/wiki/Ceph_performance, which turns out to be a gold mine of information.
What seems to be the most relevant:
Disks: When buying SSDs, go for those that support
enhanced/advanced power loss protectionand disable the disk cache usinghdparm -W 0. Very roughly speaking, these SSDs have their own CacheVault equipped and can thus achieve much higher performance than those that don’t have it, and they interpret the command to “disable the cache” in a way that they only disable the non-volatile part of their cache.Network: Jumbo Frames don’t matter; standard 10GE latency is totally ok.
Ceph being software-defined storage is CPU-bound. Disabling idle states using
cpupower idle-set -D 0and settinggovernor=performancewill boost performance.
Let’s take a deeper look at these points, and how they relate to our scenario.
Disks
By the time we bought these servers, we chose SAS disks rather than SSDs because we wanted more capacity than what we would be reasonably able to achieve with the SSDs that were available at the time. So, we can currently neither confirm nor refute these findings, but they seem interesting enough that we will keep them in mind when we think about buying hardware in the future.
In our scenario, our physical hosts are reporting a pretty steady IO
latency of 0.15 - 0.25ms for the RAID devices:
Device            r/s     w/s      r_await w_await  wareq-sz   %util
sdb              2.60   31.80         4.15    0.21     10.59    6.56
sdc              1.80   29.80         1.11    0.23      7.89    4.80
Using a RAID controller in Passthrough mode, IO latencies of the disks are exposed to the OS, and thus, to the OSD:
Device            r/s     w/s      r_await w_await  wareq-sz   %util
sdj              0.00   78.00         0.00    0.14     16.49   12.00    # OSD-DB: SSD
sdt              0.00   44.80         0.00    0.12      9.14    6.96    # OSD-DB: SSD
sdu              0.00   58.60         0.00    0.13     11.10    9.84    # OSD-DB: SSD
sdv              0.00   90.60         0.00    0.13     10.65   12.56    # OSD-DB: SSD

sdk              0.80   15.20         5.50   32.47     32.37    3.68    # OSD-Block: SAS
sdp              0.60   10.40         7.00   25.44     20.38    2.64    # OSD-Block: SAS
sdn              1.40    7.60         6.00   32.24     10.95    2.56    # OSD-Block: SAS
sds            119.40   16.80         4.78   31.87     14.33   26.96    # OSD-Block: SAS
sdm              1.40   10.00         9.86   51.64      9.36    2.72    # OSD-Block: SAS
sdl              0.80   21.60        11.00   33.73     17.85    4.32    # OSD-Block: SAS
sdq              0.60   25.20         2.00   26.94     12.83    4.64    # OSD-Block: SAS
sdr              0.80   11.00        10.00   41.27     20.15    3.04    # OSD-Block: SAS
Since we’re experiencing the same 2ms latency on both
systems, we assume that the journal SSDs are working as expected
(otherwise we would expect latency to match that of the SAS disks). Now
the question is: If disk latency on the hosts is around
0.2ms, why do the VMs experience a latency of
2ms?
Network
The article confirmed a few suspicions:
Fast network mostly matters for linear read/write and rebalancing. Yes, you need 10G or more, but usual Ethernet latencies of 0.05ms-0.1ms are totally enough for Ceph. Improving them further won’t improve your random read/write performance. Jumbo frames (mtu=9000) also only matter for linear read/write.There are two things to unpack here:
Since the latency of 1GE and 10GE are the same, a 10GE link will not give you a performance boost for your everyday operations. It does of course provide benefits for throughput-hungry operations such as VM live migration or Ceph rebalancing.
Jumbo frames don’t matter for random IO. This one surprised me a bit: A 4096-byte IO operation can not fit into a single Ethernet frame of 1500 bytes, but it can fit into a Jumbo frame of up to 9000 bytes, so I would have expected JF to boost performance. Our tests however also showed that they did not.
But of course we have to take network latency into account when evaluating Ceph’s performance, thus we checked out the numbers. Network latency is what you could expect from a normal 10GE network:
root@host001:~# ping -s4096 host002
PING host002.ad1.proemion.com (192.168.144.2) 4096(4124) bytes of data.
4104 bytes from host002.ad1.proemion.com (192.168.144.2): icmp_seq=1 ttl=64 time=0.128 ms
4104 bytes from host002.ad1.proemion.com (192.168.144.2): icmp_seq=2 ttl=64 time=0.151 ms
4104 bytes from host002.ad1.proemion.com (192.168.144.2): icmp_seq=3 ttl=64 time=0.168 ms
4104 bytes from host002.ad1.proemion.com (192.168.144.2): icmp_seq=4 ttl=64 time=0.182 ms
4104 bytes from host002.ad1.proemion.com (192.168.144.2): icmp_seq=5 ttl=64 time=0.225 ms
4104 bytes from host002.ad1.proemion.com (192.168.144.2): icmp_seq=6 ttl=64 time=0.159 ms
4104 bytes from host002.ad1.proemion.com (192.168.144.2): icmp_seq=7 ttl=64 time=0.172 ms
4104 bytes from host002.ad1.proemion.com (192.168.144.2): icmp_seq=8 ttl=64 time=0.173 ms
Ceph latency is around 2ms, so 20 times that. The Ceph documentation has a nice visualization of how writes work:
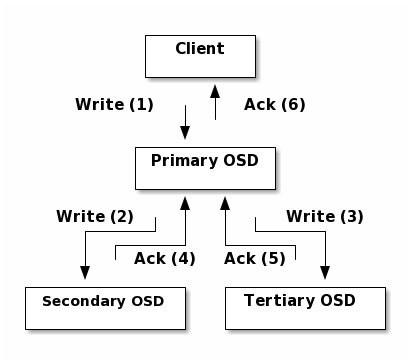
This indicates that Ceph takes somewhere between two and three round
trips for a write. So in total, we’d get a network latency of somewhere
between 0.128 * 2 = 0.256ms and
0.225 * 3 = 0.675ms. This is still nowhere near the
2ms that our VMs are seeing, and even if you add the
0.1ms of Disk latency that the hosts are reporting. Thus,
Ceph’s time is spent elsewhere.
Ceph is CPU-bound
This is an interesting point: Since we have already concluded that our disks and network are fine, this must mean that Ceph spends its time waiting for something else. Pretty much the only resource left now is the CPU. Thus, this is where the Wiki article attacks next.
Since we wanted to start with the easiest thing that we could, we decided to go for the CPU idle state and frequency governor configurations.
Note that in the PVE kernel, CPU frequency governors seem to be missing completely. Thus we were not able to change them and measure their impact.
We did not yet try disabling cephx signatures, because we were unsure of the implications of such a change. It does seem sensible though in the sense that calculating signatures is going to take time, which will probably impact latency. However, we can only be sure after measuring, so don’t take my word for it.
CPU Idle states
We did however disable idle states by running:
cpupower idle-set -D 0, on the cluster that is using the
RAID-based setup. Immediately after this change, the
biolatency readings confirmed that the 2ms
barrier had been blown right out the window:
Filestore:
       512 -> 1023       : 62       |*******************************         |
      1024 -> 2047       : 67       |*********************************       |
      2048 -> 4095       : 56       |****************************            |
      4096 -> 8191       : 79       |****************************************|
Bluestore:
       512 -> 1023       : 7        |**                                      |
      1024 -> 2047       : 118      |************************************    |
      2048 -> 4095       : 5        |*                                       |
      4096 -> 8191       : 130      |****************************************|
Note that Filestore and Bluestore are still on par, with Filestore even being slightly faster.
Caveats:
This caused the CPU temperature to increase by 20°C, from 35°C to 55°C. Note that these hosts were pretty much idle, so their operating temperature was lower than you’d expect if the hosts had been under load. When we made the same change in the other cluster (which has a lot higher load to begin with), temperature only increased by 2°C, from 65°C to 67°C. We expect that power consumption has increased accordingly.
-
When we did the same change on the cluster that is using the passthrough OSD layout, we were unable to measure any latency improvement whatsoever. There are two explanations that we can come up with:
This cluster has a lot more load, thus the CPUs are never in any of those idle states to begin with, thus disabling them does not yield a benefit.
This cluster has a lot more load, thus there are a lot more other things going on that take CPU time and thus increase write IO latency.
Filestore vs Bluestore (again)
Since I’m having a hard time accepting that Bluestore actually made
things worse, I was wondering if the improvement only applied to
sequential IO. Thus I ran fio with 4MB IOs
rather than 4k.
Filestore 4k:
     usecs               : count     distribution
       256 -> 511        : 21       |                                        |
       512 -> 1023       : 38199    |****************************************|
      1024 -> 2047       : 451      |                                        |
      2048 -> 4095       : 51       |                                        |
      4096 -> 8191       : 12       |                                        |
Bluestore 4k:
     usecs               : count     distribution
       256 -> 511        : 0        |                                        |
       512 -> 1023       : 30901    |****************************************|
      1024 -> 2047       : 896      |*                                       |
      2048 -> 4095       : 130      |                                        |
      4096 -> 8191       : 96       |                                        |
      8192 -> 16383      : 11       |                                        |
Filestore 4M:
     usecs               : count     distribution
       256 -> 511        : 0        |                                        |
       512 -> 1023       : 4216     |**********************************      |
      1024 -> 2047       : 125      |*                                       |
      2048 -> 4095       : 42       |                                        |
      4096 -> 8191       : 3545     |*****************************           |
      8192 -> 16383      : 4821     |****************************************|
     16384 -> 32767      : 90       |                                        |
     32768 -> 65535      : 60       |                                        |
     65536 -> 131071     : 28       |                                        |
Bluestore 4M:
     usecs               : count     distribution
       256 -> 511        : 0        |                                        |
       512 -> 1023       : 4059     |***********************************     |
      1024 -> 2047       : 152      |*                                       |
      2048 -> 4095       : 37       |                                        |
      4096 -> 8191       : 3578     |*******************************         |
      8192 -> 16383      : 4548     |****************************************|
     16384 -> 32767      : 132      |*                                       |
     32768 -> 65535      : 47       |                                        |
     65536 -> 131071     : 17       |                                        |
So it seems that the difference is pretty much zero. :(
Conclusion
Unfortunately we have not yet arrived at one. The CPU idle states
seem to be able to make a difference under certain circumstances, which
we are yet to define clearly, so if you want a quick take-away from this
article, give cpupower idle-set -D 0 a try. Chances are
that it might improve things for you, but just as well it might not. We
will keep looking for a reliable way to provide sub-ms latency.