NodeRED-based MQTT Browser
I’ve recently started building stuff with NodeRED, which I really enjoy. Since I’m using MQTT as the central message bus for my system, I find myself regularly in need of knowing the current state of my MQTT topics. There are a couple of tools around, for instance MQTT.fx, which are specifically built for this purpose; but I found that MQTT.fx likes to cause high CPU load when the topic scanner thingy is running. So I’m looking for an alternative, and I thought, why not build it in NodeRED? So that’s what I did.
Here’s what the flow looks like:
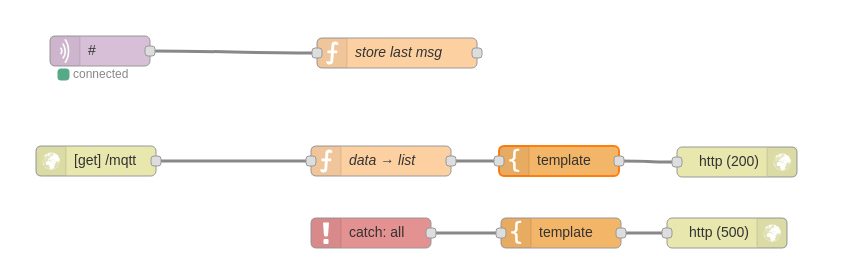
This flow consists of three parts:
- The topmost line stores all incoming data into the Flow context.
- The middle line serves HTTP requests and responds with a table of current data.
- The bottom line catches errors and responds with an Error page for debugging.
Storing incoming data
Storing incoming data is pretty easy: I attached an MQTT input node
to the topic of # (that is, all topics), and
configured it to send data to a function node that runs this code:
var data = flow.get("data") || {};
data[msg.topic] = {
    value: msg.payload,
    time:  new Date()
};
flow.set("data", data);
return msg;
This adds a data variable to the Flow context and
stores, for each topic, the last message received and the time that
message arrived. That’s it.
Rendering the browser page
This part proves to be a bit trickier. It first of all requires an
HTTP input node bound to a URL (I used /mqtt), so that we
have a URL to point our browser to. Then we need a function node to
retrieve our data from the Flow context and turn it into a list to be
processed by the template node, and a template node to render it into a
(somewhat) nice table view for the humans to consume. Lastly, we pipe
the result into an HTTP response node with its status code set to
200.
Here’s the code that transforms the list:
var data = flow.get("data") || {};
var data_list = [];

Object.keys(data).sort().forEach(function(topic){
    data_list.push({
        "topic": topic,
        "value": data[topic].value,
        "time":  data[topic].time,
    })
});

msg.payload = data_list;
return msg;
(Note that this node needs to return the original msg
object instead of creating a new one, because the original object
carries some metadata about the request that the response node will need
to function correctly.)
And here’s the template to render it:
<meta http-equiv="refresh" content="5" />

<h1>MQTT Data</h1>

<table>
    <thead>
        <th>Topic</th>
        <th>Value</th>
        <th>Received</th>
    </thead>
    <tbody>
{{#payload}}
        <tr>
          <th>{{topic}}</th>
          <td>{{value}}</td>
          <td>{{time}}</td>
        </tr>
{{/payload}}
    </tbody>
</table>
Catching errors
The bottom-most line that catches errors is again pretty simple: Use
a catch: all input node, attach it to a template node, and
pipe the result into an http output node with its status code set to
500. Here’s the template:
<h1>Error: {{error.message}}</h1>

<p>Source: {{error.source.name}}</p>
Result
Now if you open a Browser and point it to
http://your-node-red/mqtt, here’s what the result looks
like:
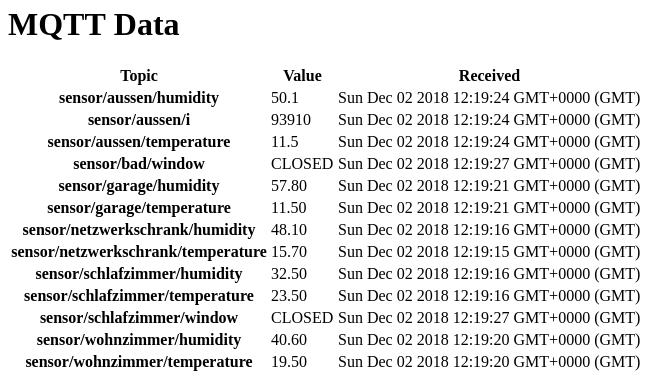
The page will display more and more data over time, depending on how
frequently your MQTT devices are sending data. The meta tag
included in the template instructs your browser to reload the page
automatically every 5 seconds.